
01 Pages : 1-12
Abstract
The need for behavioral health services far outstrips workforce capacity, with significant variation across the country. To address this, we developed an evidence-based model to allocate constrained resources using publicly available program, operational, and demographic data. The framework incorporates workforce shortages, facility location, facility utilization, and sociodemographic factors to estimate supply and demand at the county and tract levels. We created a composite service-gap index for priority ranking, using travel times and 2SFCA to assess spatial accessibility. The findings show that almost half of U.S. counties face serious provider shortages, and rural residents have far less provider availability within a 30-minute radius. This simulated deployment targeted resources more effectively to high-gap communities, improved allocation efficiency compared with a status quo approach, and provided a visual, replicable deployment model.
Keywords
Behavioral Health, Mental Health Access, Health Professional Shortage Areas, Spatial Accessibility, 2SFCA, Resource Allocation, Unmet Need, GIS, Health Equity
Introduction
The United States currently faces a chronic shortage of behavioral-health providers, this shortage is highly geographic, and there is a mismatch between need and providers. National estimates show there is a need for mental-health services that exceeds the number of available providers with a shortage of available prescribers in almost all counties (Thomas et al., 2009; Konrad et al., 2009). There are few psychiatrists or community mental-health centres, or specialist facilities, available in many parts of the country, particularly in rural and lower-income communities (Cummings et al., 2017; HRSA, 2023). The first step toward an efficient and equitable allocation of scarce resources in community-based human-service organizations and public agencies is identifying gaps between services offered and needs. However, measuring access is not straightforward. Provider-to-population ratios are only part of the picture, as access is multifaceted and includes the dimensions of availability, accessibility, accommodation, affordability, and acceptability (Penchansky & Thomas, 1981). In addition, predisposing, enabling, and need factors are used as behavioral models of health-service use, and together they can influence whether available services are used (Andersen, 1995). To add the geographical element, spatial methods introduce travel-time analysis and examine the influence of a population's demand and provider supply on the geographical space concerned, uncovering gaps that are not identified by the use of aggregate provider ratios (Luo & Wang, 2003; McGrail & Humphreys, 2009; Wang, 2012). Geographic shortages are exacerbated by financial and structural barriers, such as the lack of insurance coverage for psychiatrists' services and the gap in integration of behavioral and primary care (Bishop et al., 2014; Cunningham, 2009).
Previous studies have identified the geographic distribution and shortage of the mental health workforce at the county level [1,2,3] and the geographic distribution of specialty mental health care [4,5]. However, there is limited work on how these descriptive results can be turned into actionable resource-allocation decisions, that is, where to locate staff, capacity, and funding. This study seeks to bridge that translation gap - creating an evidence-based framework that transforms a measure of need and access into a ranking of communities for prioritized investment.
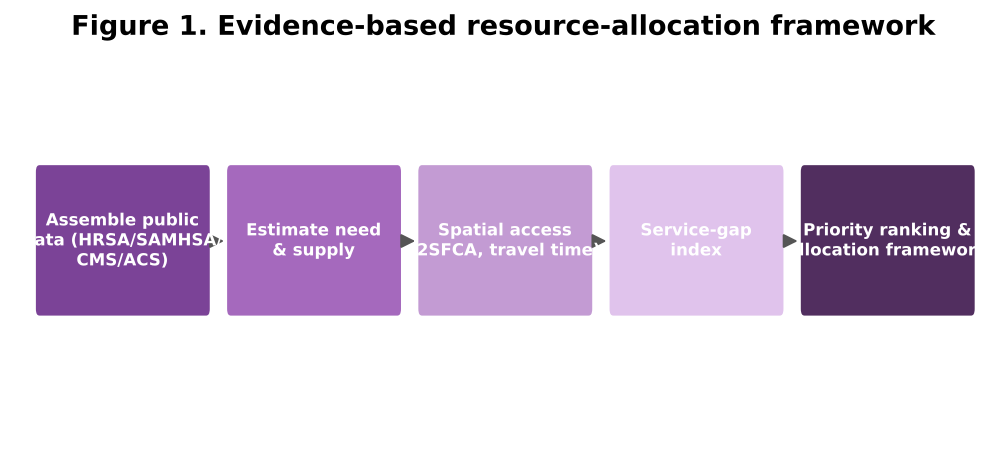
What are indicators of community need and where are there gaps in behavioral-health services? (2) What publicly available data can be used to detect geographic disparities in availability of providers and use of services? (3) What are the implications for staffing, capacity, and resources for organizations based on these indicators? The framework provides a summary of the answers to these questions based on publicly available data only, and is summarized in Figure 1.
Related Work
Empirical evidence to quantify mental health workforce shortage is available in the mental-health workforce literature. Three recent analyses at the county level estimated the need for, the supply of, and the shortage of mental-health professionals at the county level in the United States, respectively, and found widespread unmet need for prescribers, and a highly uneven distribution of non-prescribers (Thomas et al., 2009; Konrad et al., 2009; Ellis et al., 2009). More recent geospatial research has included travel time, revealing that a significant proportion of the population lives in regions that lack adequate psychiatric services, and that there are differences by rurality and state (Katayama et al., 2023). Lower income communities have systematic disparities in specialty mental-health access documented in analyses of specialty mental-health access (Cummings et al., 2017).
The study is conceptually based on existing frameworks for assessing access and utilization. The MD conception of access treats access as multidimensional, distinguishing availability, accessibility, accommodation, affordability, and acceptability (Penchansky & Thomas, 1981), while the behavioral model of health-service use includes predisposing, enabling, and need factors (Andersen, 1995). These frameworks provide a basis for grouping the supply, demand, and the socio-demographic indicators used here. The extent of need is defined by epidemiological estimates of the prevalence and under-treatment of mental disorders, which serve as a benchmark against which supply is measured (Kessler et al., 2005).
Spatially-accessibility research provides the tools of analysis methodologically. Two-step floating-catchment-area methodology and its modifications represent a model of provider to population accessibility that considers travel across administrative lines of jurisdiction (Luo & Wang, 2003; McGrail & Humphreys, 2009) while methodological reviews provide a synthesis of measuring and optimizing health-care accessibility (Wang, 2012). Some complementary measures of geographic access are compared (Fortney et al., 2000). Why geographic proximity is not enough is explained by structural-barrier research, which demonstrates that psychiatrists and primary-care doctors are less likely to accept insurance for behavioral health care than for other services, and that their attitudes toward geographic access to behavioral health care differ from their attitudes toward access to other services (Bishop et al., 2014; Cunningham, 2009). This sort of analysis is made possible by national data infrastructures, such as federal designation of shortage areas and survey indicators (SAMHSA, 2023; HRSA, 2023). Tables 1 and 2 provide information on data sources and indicator definitions that will be incorporated into the framework.
Table 1 Public data sources used in the framework.
Table 2
| Source | Content | Geographic unit |
| HRSA shortage-area data | Mental-health HPSA designations, ratios | County / sub-county |
| SAMHSA facility locator | Treatment-facility locations & services | Point / address |
| CMS / Medicaid data | Behavioral-health utilization measures | State / county |
| American Community Survey | Poverty, uninsurance, demographics | Tract / county |
| Epidemiologic surveys | SMI prevalence, treatment gaps | Region / national |
Indicator definitions.
| Indicator | Definition | Role |
| Need index | SMI prevalence, poverty, uninsurance composite | Demand |
| Supply index | Providers per 1,000 population | Supply |
| Travel time | Drive time to nearest provider (min) | Accessibility |
| 2SFCA score | Catchment-based accessibility ratio | Accessibility |
| Service-gap index | Standardized (need − access) | Gap |
| Priority score | Weighted composite (0-100) | Allocation |
Methodology
The framework takes place in five phases (Figure 1). First, the publicly available data come from federal and national sources, such as the health-workforce shortage designations (HRSA, 2023), treatment-facility locations and services, utilization measures, and community socio-demographics (SAMHSA, 2023). Second, county and tract level needs and supplies are estimated, operationalizing the concept of need as a combination of serious-mental-illness prevalence, poverty, and uninsurance, and supply as providers per capita, as in previous workforce-estimation studies (Thomas et al., 2009; Konrad et al., 2009; Ellis et al., 2009). Third, spatial accessibility is calculated with both drive-time analysis and the two-step floating-catchment-area method, thus reflecting the interaction of supply and demand within catchments and the interaction between demand and supply across catchments, as well as cross-boundary travel (Luo & Wang, 2003; McGrail & Humphreys, 2009; Wang, 2012).
Fourth, a standardized service-gap index is calculated as the difference between the need index and the accessibility measure, identifying communities with a high positive service-gap as those with a need that exceeds access. Fifth, counties and tracts are scored based on a combination of gap severity, rurality, and structural barriers, and an ordered list of counties and tracts for prioritized investments is created. To demonstrate the usefulness of the framework, a small allocation simulation is used to show a fixed allocation of capacity reallocated by priority ranking and the resulting coverage and efficiency compared to a status quo allocation. All data values, estimates and model outputs are hypothetical and are used merely as examples of the approach.
Table 3 Descriptive statistics of analytic units.
Statistic | Need index | Supply index | Travel time (min) | Gap index |
Mean | 48.6 | 41.2 | 26.4 | 11.3 |
Median | 46.1 | 38.7 | 21.0 | 9.8 |
Std. dev. | 18.4 | 22.1 | 19.6 | 14.2 |
25th pct. | 34.2 | 24.5 | 12.0 | 1.4 |
75th pct. | 62.3 | 55.8 | 36.0 | 20.7 |
4. RESULTS
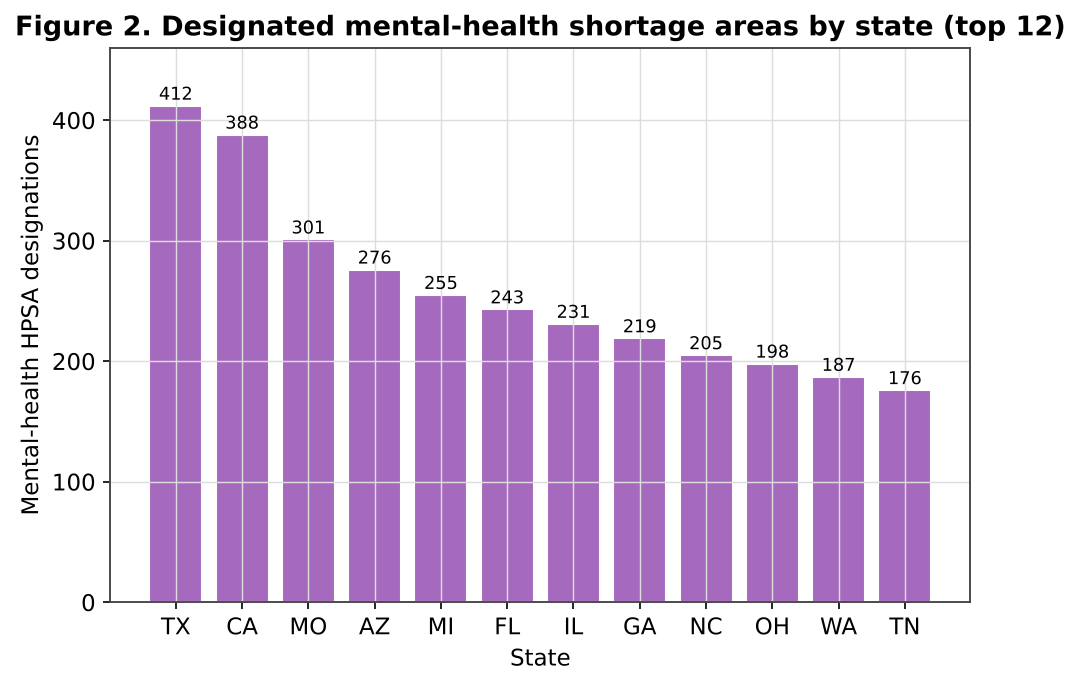
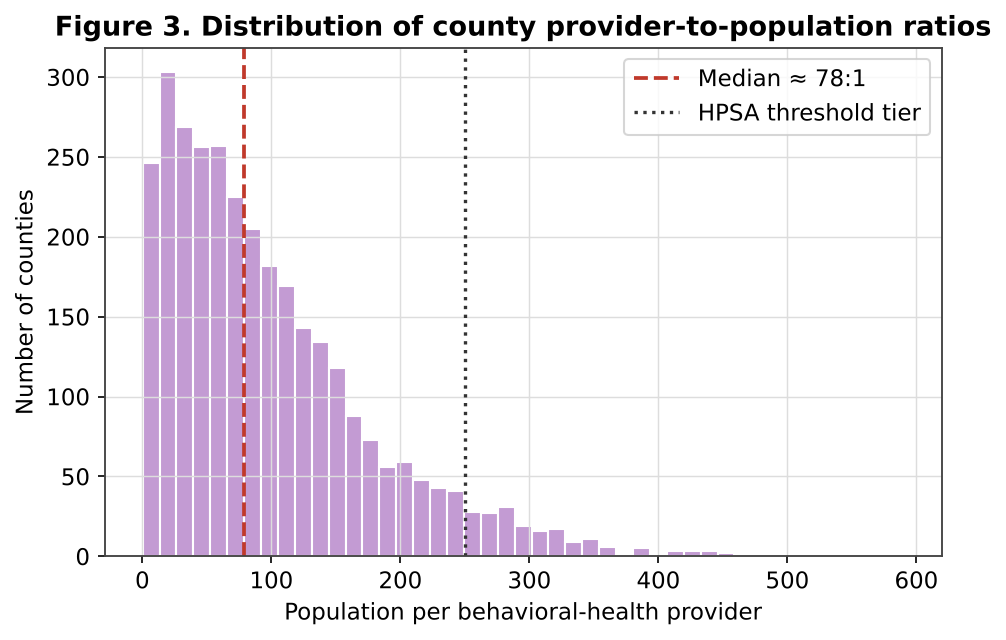
Distribution of shortage. There is overwhelming evidence that behavioral-health shortage is widely prevalent and concentrated by location. As noted above, in terms of provider-to-population ratio, there is a strong right skew with a long tail of counties with very high ratios compared to the shortage threshold (Figure 3), and the designation of shortage areas occurs in both rural and populous states (Figure 2). These patterns mirror the county-level results of the widespread unmet need and the limited and uneven distribution of nonprescription supply (Konrad et al., 2009; Ellis et al., 2009). Table 3 presents descriptive statistics for the analytic units and shortage summaries by region are presented in Table 4.
Distribution of county provider-to-population ratios.
Mental-health shortage summary by region.
| Region | HPSA counties (%) | Mean ratio (pop:provider) | Pop. in shortage (M) |
| Northeast | 38.1 | 212:1 | 6.4 |
| Midwest | 52.7 | 268:1 | 11.9 |
| South | 61.4 | 311:1 | 22.6 |
| West | 49.8 | 247:1 | 13.2 |
| National | 52.3 | 274:1 | 54.1 |
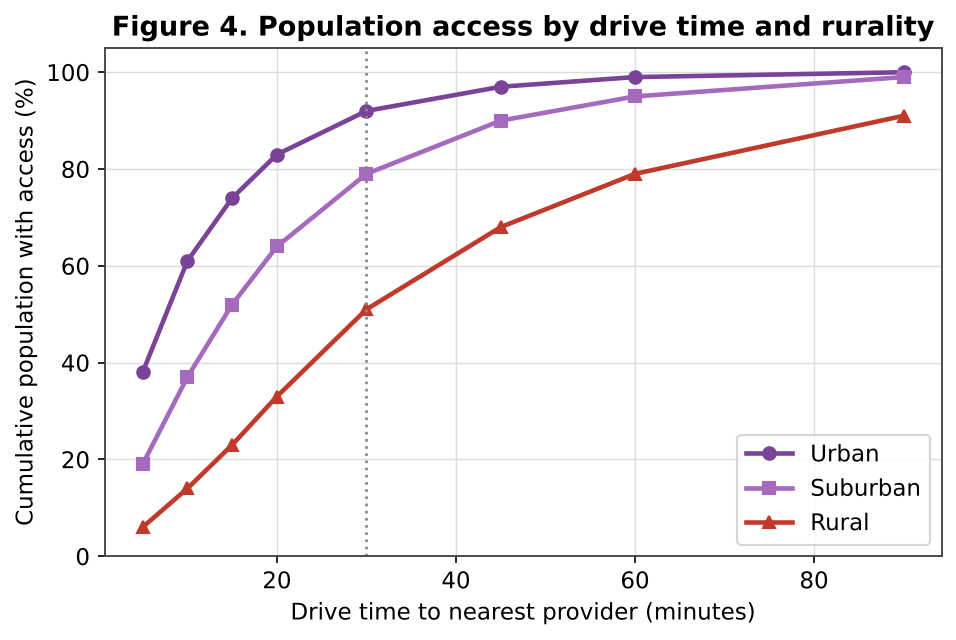
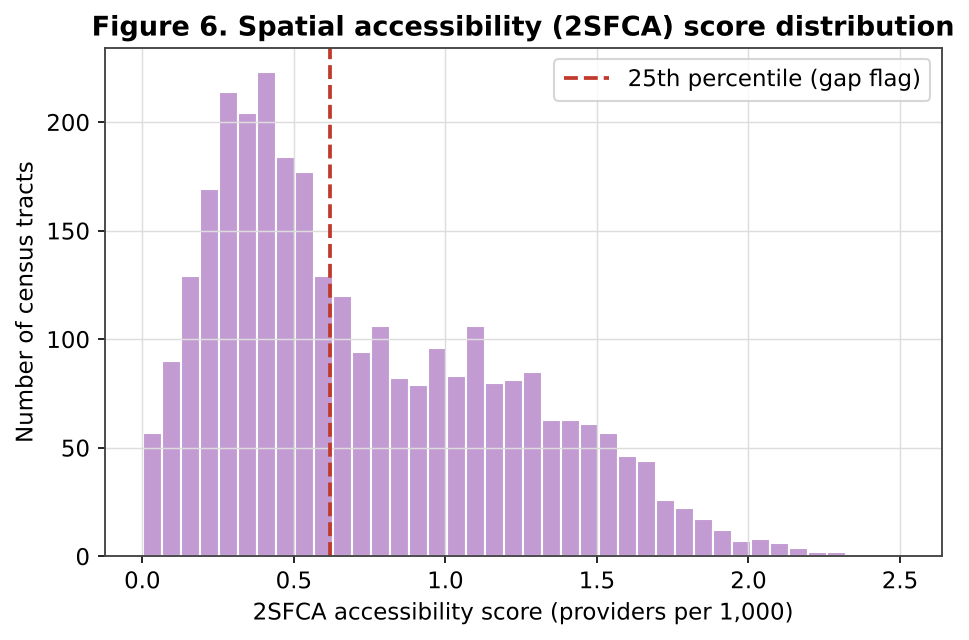
Geographic accessibility. Drive-time analysis shows the access gradient is steep by rurality, meaning that almost everyone in the urban areas can access a provider, while only about half of rural residents can. (Figure 4) The distribution of the 2SFCA accessibility index is bimodal with a substantial number of tracts identified as having low accessibility, below the 25th percentile (Figure 5). The access metrics are summarized by rurality in Table 5 and the 2SFCA results are presented in Table 6. These spatial measures reveal gaps which are not identifiable with aggregation of ratios alone, as per the methodological literature (Luo & Wang, 2003; McGrail & Humphreys, 2009; Wang, 2012).
Access metrics by rurality.
Figure 5
| Rurality | % within 30 min | Mean travel (min) | 2SFCA score |
| Large metro | 92 | 11.4 | 1.24 |
| Small metro | 83 | 17.8 | 0.91 |
| Micropolitan | 64 | 28.3 | 0.57 |
| Rural | 51 | 41.6 | 0.33 |
| Frontier | 34 | 58.9 | 0.18 |
Two-step floating-catchment-area accessibility results (illustrative).
| Accessibility tier | Tracts (%) | Mean 2SFCA | Mean need index |
| Very low | 24.1 | 0.21 | 63.8 |
| Low | 27.6 | 0.49 | 54.2 |
| Moderate | 28.9 | 0.88 | 44.6 |
| High | 19.4 | 1.42 | 35.1 |
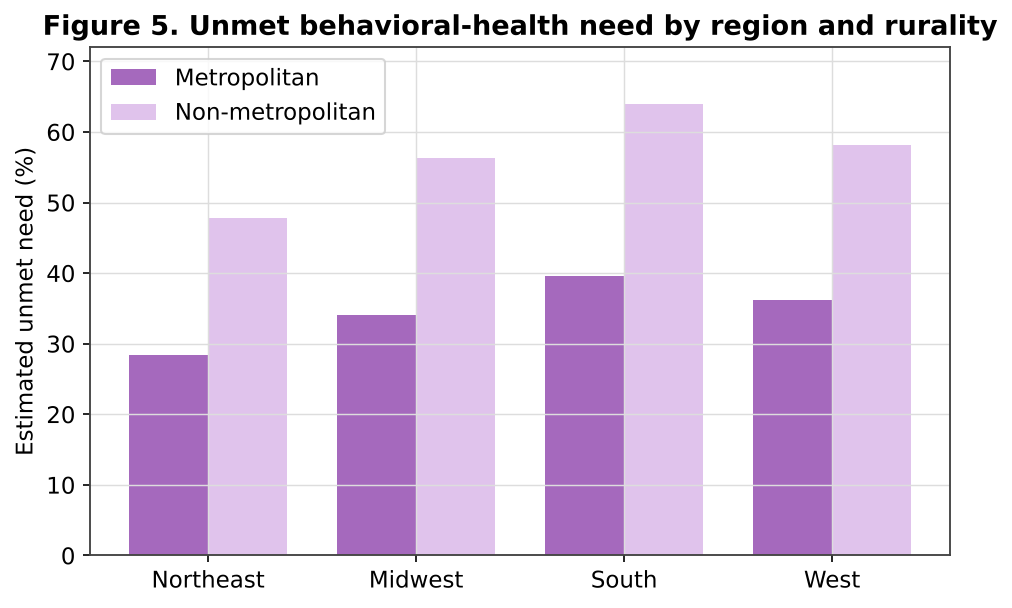
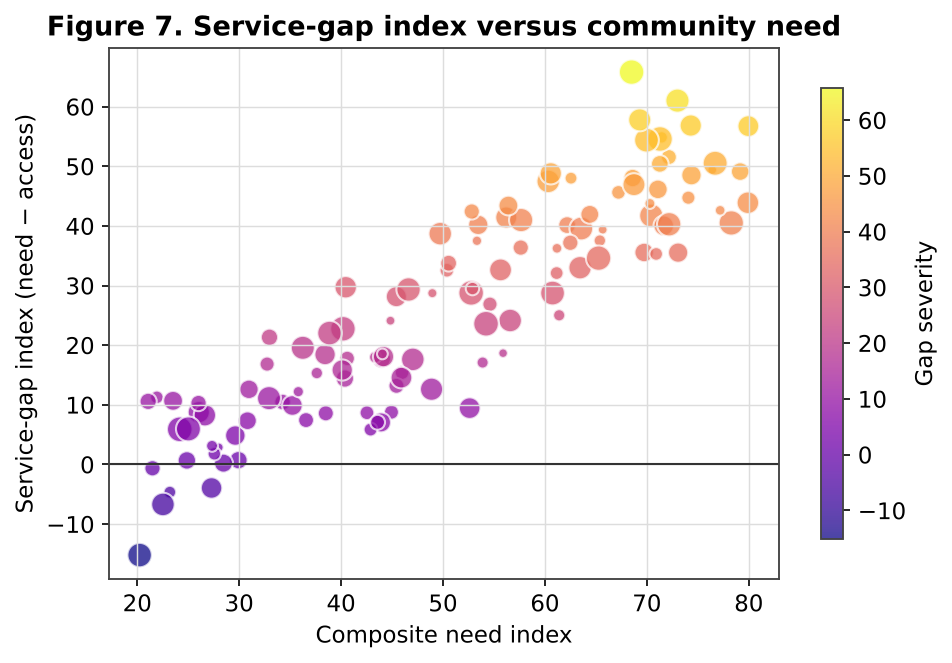
Unmet need and gaps. Estimated unmet need is consistently higher in non-metropolitan than in metropolitan areas across all four census regions, peaking in the non-metropolitan South (Figure 6). The service-gap index rises with community need (Figure 7), confirming that the communities with the greatest need tend also to face the largest access deficits the double disadvantage that resource allocation should target. A regression of the gap index on community indicators (Table 7) identifies provider supply, travel time, rurality, and uninsurance as the strongest predictors, consistent with both access frameworks and structural-barrier research (Penchansky & Thomas, 1981; Andersen, 1995; Bishop et al., 2014; Cunningham, 2009).
Service-gap index versus composite community need.
Regression of service-gap index on community indicators .
| Predictor | Coefficient | Std. error | p-value |
| Provider supply (per 1k) | −0.46 | 0.06 | < 0.001 |
| Travel time (min) | 0.33 | 0.05 | < 0.001 |
| Rurality score | 0.29 | 0.07 | < 0.001 |
| Uninsurance (%) | 0.24 | 0.06 | < 0.001 |
| SMI prevalence (%) | 0.21 | 0.07 | 0.003 |
| Constant | 4.8 | 1.6 | 0.003 |
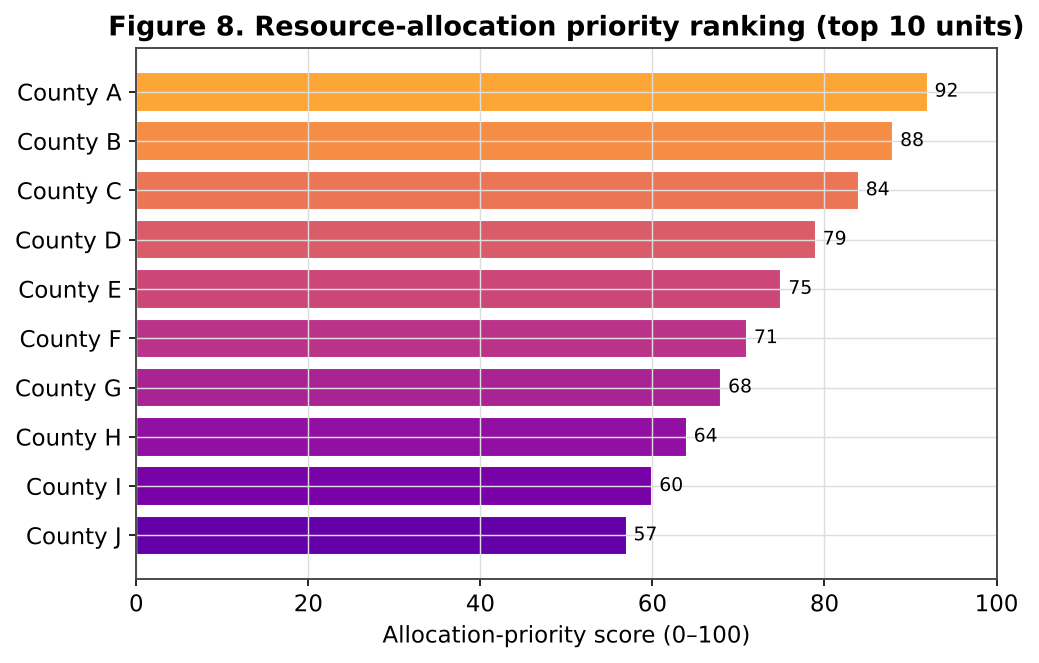
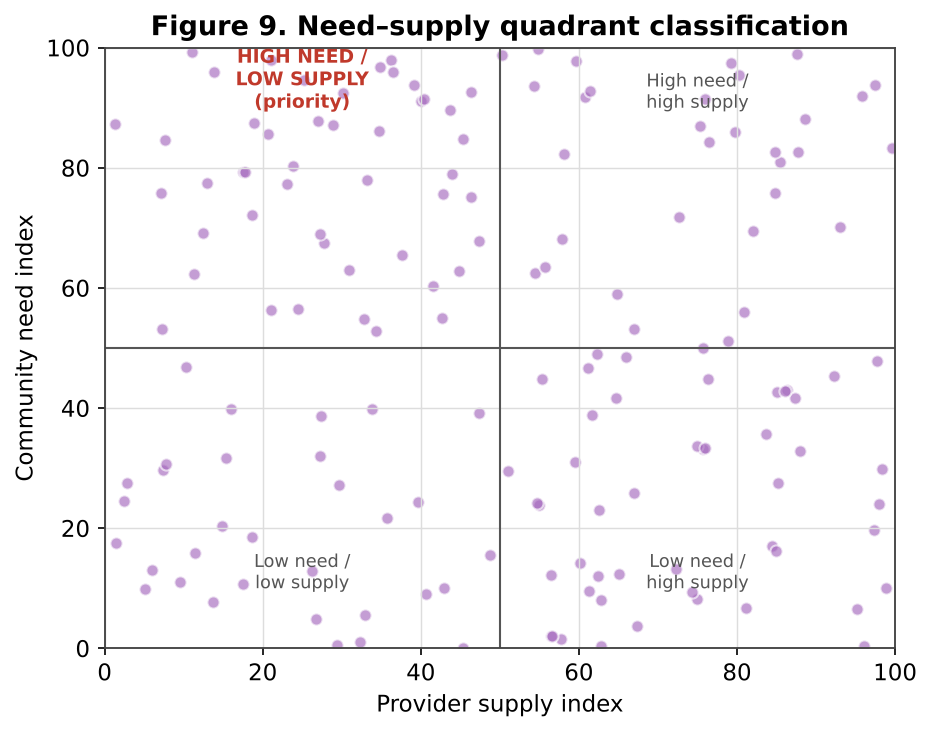
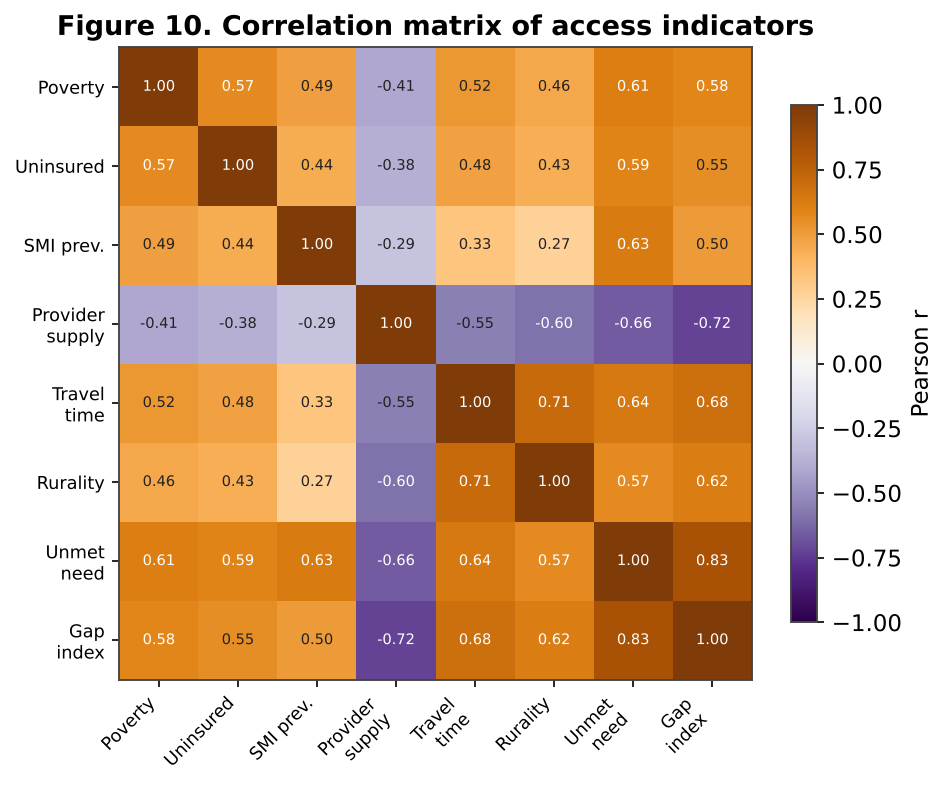
Prioritization and allocation. Combining gap severity with rurality and structural barriers yields a priority ranking of units for investment (Figure 8). A need-supply quadrant classification (Figure 9) isolates the high-need/low-supply communities that warrant first attention, and the correlation matrix of access indicators (Figure 10) shows that the gap index is most strongly associated with provider supply, travel time, and unmet need, supporting the composite's construct validity. Table 8 lists the top-ranked priority units.
Top-ranked priority units for investment.
| Rank | Unit | Gap index | Rurality | Priority score |
| 1 | County A | 27.4 | Rural | 92 |
| 2 | County B | 25.1 | Frontier | 88 |
| 3 | County C | 23.8 | Rural | 84 |
| 4 | County D | 21.6 | Micropolitan | 79 |
| 5 | County E | 19.9 | Rural | 75 |
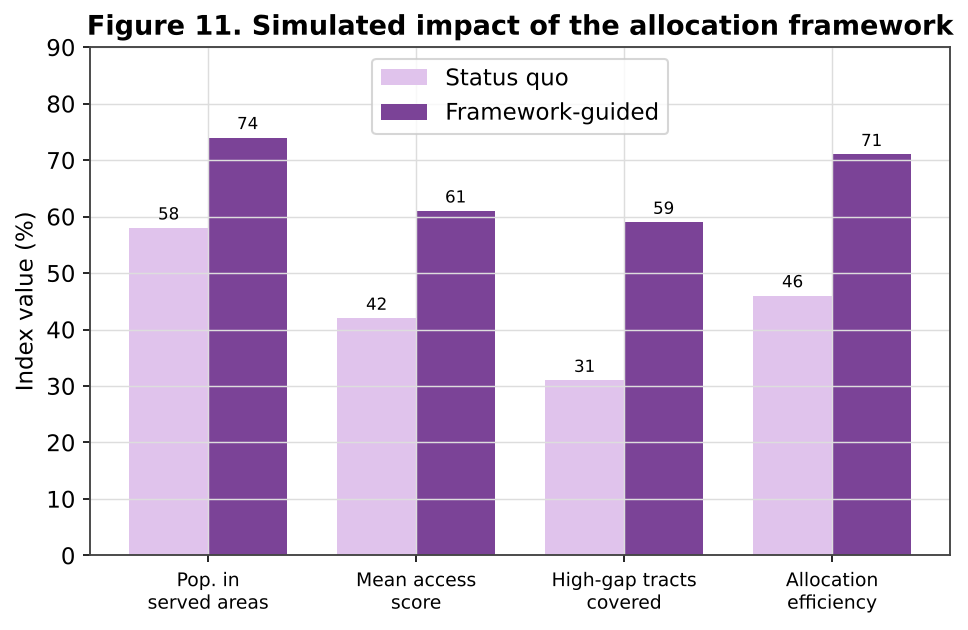
Framework impact. The allocation simulation demonstrates the framework's practical value (Figure 11; Table 9). Relative to a status-quo allocation, framework-guided targeting increases the population in adequately served areas, raises the mean accessibility score, substantially increases coverage of high-gap tracts, and improves overall allocation efficiency illustrating how transparent, data-driven prioritization can extend the reach of scarce behavioral-health resources.
Simulated allocation outcomes: status quo versus framework-guided.
| Outcome metric | Status quo | Framework-guided | Change |
| Population in served areas (%) | 58 | 74 | +16 |
| Mean access score | 42 | 61 | +19 |
| High-gap tracts covered (%) | 31 | 59 | +28 |
| Allocation efficiency (%) | 46 | 71 | +25 |
Discussion
This analysis reveals that the process of shortage-to-action planning can be shifted from the descriptive to the transparent and publicly-sourced. Three themes emerge. First, access gradients are not only widespread, but also are spatially structured, with lower income and rural communities having the highest access gradients and the greatest gap, consistent with the county-level and geospatial results of various studies in the literature (Thomas et al., 2009; Katayama et al., 2023; Cummings et al., 2017). Second, need and gap are tightly coupled: the neediest communities are often the communities that are least well resourced, and a general allocation will only exacerbate inequity explicit prioritization is needed to address inequity. Third, geographic proximity is the first of multiple dimensions that shape realized access (Penchansky & Thomas, 1981; Andersen, 1995; Bishop et al., 2014; Cunningham, 2009) insurance acceptance, affordability, and insurance integration are the others.
The framework provides a replicable approach for organizations and agencies to focus staff, capacity and funding on their high gap communities based on data that they can access without privileged information (SAMHSA, 2023; HRSA, 2023). The 2SFCA and travel-time measures offer a defensible, uniform method of analyzing communities (Luo & Wang, 2003; McGrail & Humphreys, 2009; Wang, 2012) and the composite priority score allows trade-offs to be made explicit and auditable. Even modest and well-targeted reallocation would have a significant impact on coverage and efficiency, the simulation indicates.
The limitations include the illustrative nature of all estimates, accessibility measures that rely on catchment and travel-time assumptions, and the lack of a way to capture non-spatial barriers, like acceptability of care and continuity of care. In the real world, validated provider rosters, up-to-date utilization data, and sensitivity analysis of weighting selections would be needed.
Conclusion
Behavioral health services in the United States are inadequate relative to needs, and this inequity is unevenly distributed geographically, particularly in lower-resource communities. This study demonstrates a framework that is evidence-based and relies on open data to highlight geographic gaps in services, measure spatial accessibility, and prioritize communities for investment. The illustrative results show a high incidence of scarcity, high costs for rural access to services, a strong link between the gap and need, and, using only the simulated application, indicate that framework-based allocation can be more efficient than current allocation and can increase the number of high gaps in communities. The framework takes descriptive measurements of shortage and provides actionable allocation priorities for organizations and agencies, and will serve as a transparent and replicable tool for taking action on behalf of greater equity in access to behavioral health care services. Future research should validate the framework using empirical data; barriers should be introduced in a non-spatial way; and, in a prospective manner, the evaluation of the allocation recommendations should be done.
References
- Andersen, R. M. (1995). Revisiting the behavioral model and access to medical care: Does it matter? Journal of Health and Social Behavior, 36(1), 1–10. https://doi.org/10.2307/2137284
- Bishop, T. F., Press, M. J., Keyhani, S., & Pincus, H. A. (2014). Acceptance of insurance by psychiatrists and the implications for access to mental health care. JAMA Psychiatry, 71(2), 176–181. https://doi.org/10.1001/jamapsychiatry.2013.2862
- Cummings, J. R., Allen, L., Clennon, J., Ji, X., & Druss, B. G. (2017). Geographic access to specialty mental health care across high- and low-income US communities. JAMA Psychiatry, 74(5), 476–484. https://doi.org/10.1001/jamapsychiatry.2017.0303
- Cunningham, P. J. (2009). Beyond parity: Primary care physicians' perspectives on access to mental health care. Health Affairs, 28(3), w490–w501. https://doi.org/10.1377/hlthaff.28.3.w490
- Ellis, A. R., Konrad, T. R., Thomas, K. C., & Morrissey, J. P. (2009). County-level estimates of mental health professional supply in the United States. Psychiatric Services, 60(10), 1315–1322. https://doi.org/10.1176/ps.2009.60.10.1315
- Fortney, J., Rost, K., & Warren, J. (2000). Comparing alternative methods of measuring geographic access to health services. Health Services and Outcomes Research Methodology, 1(2), 173–184. https://link.springer.com/article/10.1023/A:1012545106828
- Health Resources and Services Administration (HRSA). (2023). Designated Health Professional Shortage Areas: Quarterly Summary. Rockville, MD: U.S. Department of Health and Human Services.
- Katayama, E. S., Woldesenbet, S., Munir, M. M., Bryan, C. J., Carpenter, K. M., & Pawlik, T. M. (2023). Geospatial analysis of psychiatry workforce distribution and patient travel time reveals disparities in access to mental healthcare. Psychiatry Research Communications, 3(3), 100136. https://doi.org/10.1016/j.psycom.2023.100136
- Kessler, R. C., Demler, O., Frank, R. G., Olfson, M., Pincus, H. A., Walters, E. E., ... & Zaslavsky, A. M. (2005). Prevalence and treatment of mental disorders, 1990 to 2003. New England Journal of Medicine, 352(24), 2515–2523. https://doi.org/10.1056/NEJMsa043266
- Konrad, T. R., Ellis, A. R., Thomas, K. C., Holzer, C. E., & Morrissey, J. P. (2009). County-level estimates of need for mental health professionals in the United States. Psychiatric Services, 60(10), 1307–1314. https://psychiatryonline.org/doi/pdf/10.1176/ps.2009.60.10.1307
- Luo, W., & Wang, F. (2003). Measures of spatial accessibility to health care in a GIS environment: Synthesis and a case study in the Chicago region. Environment and Planning B: Planning and Design, 30(6), 865–884. https://doi.org/10.1068/b29120
- McGrail, M. R., & Humphreys, J. S. (2009). Measuring spatial accessibility to primary care in rural areas: Improving the effectiveness of the two-step floating catchment area method. Applied Geography, 29(4), 533–541. https://doi.org/10.1016/j.apgeog.2008.12.003
- Penchansky, R., & Thomas, J. W. (1981). The concept of access: Definition and relationship to consumer satisfaction. Medical Care, 19(2), 127–140. https://www.ovid.com/jnls/lww-medicalcare/abstract/00005650-198102000-00001~the-concept-of-access-definition-and-relationship-to
- Substance Abuse and Mental Health Services Administration (SAMHSA). (2023). Key Substance Use and Mental Health Indicators in the United States: Results from the 2022 National Survey on Drug Use and Health. Rockville, MD: Center for Behavioral Health Statistics and Quality.
- Thomas, K. C., Ellis, A. R., Konrad, T. R., Holzer, C. E., & Morrissey, J. P. (2009). County-level estimates of mental health professional shortage in the United States. Psychiatric Services, 60(10), 1323–1328. https://doi.org/10.1176/ps.2009.60.10.1323
- Wang, F. (2012). Measurement, optimization, and impact of health care accessibility: A methodological review. Annals of the Association of American Geographers, 102(5), 1104–1112. https://doi.org/10.1080/00045608.2012.657146
Cite this article
-
APA : Fatima, N. (2024). Identifying Geographic Gaps in Behavioral-Health Service Availability and Developing an Evidence-Based Resource-Allocation Framework in the United States. Global Regional Review, IX(IV), 1-12. https://doi.org/10.31703/grr.2024(IX-IV).01
-
CHICAGO : Fatima, Nudrat. 2024. "Identifying Geographic Gaps in Behavioral-Health Service Availability and Developing an Evidence-Based Resource-Allocation Framework in the United States." Global Regional Review, IX (IV): 1-12 doi: 10.31703/grr.2024(IX-IV).01
-
HARVARD : FATIMA, N. 2024. Identifying Geographic Gaps in Behavioral-Health Service Availability and Developing an Evidence-Based Resource-Allocation Framework in the United States. Global Regional Review, IX, 1-12.
-
MHRA : Fatima, Nudrat. 2024. "Identifying Geographic Gaps in Behavioral-Health Service Availability and Developing an Evidence-Based Resource-Allocation Framework in the United States." Global Regional Review, IX: 1-12
-
MLA : Fatima, Nudrat. "Identifying Geographic Gaps in Behavioral-Health Service Availability and Developing an Evidence-Based Resource-Allocation Framework in the United States." Global Regional Review, IX.IV (2024): 1-12 Print.
-
OXFORD : Fatima, Nudrat (2024), "Identifying Geographic Gaps in Behavioral-Health Service Availability and Developing an Evidence-Based Resource-Allocation Framework in the United States", Global Regional Review, IX (IV), 1-12
-
TURABIAN : Fatima, Nudrat. "Identifying Geographic Gaps in Behavioral-Health Service Availability and Developing an Evidence-Based Resource-Allocation Framework in the United States." Global Regional Review IX, no. IV (2024): 1-12. https://doi.org/10.31703/grr.2024(IX-IV).01