
Abstract
This study is conducted in two steps. Firstly, Stochastic Frontier Approach (SFA) is applied to estimate efficiency of the Takaful and conventional insurance firms in Pakistan from 2005 to 2010. It is found that life insurers are performing poor in comparison to general insurers. In addition, Takaful firms are found less cost efficient in comparison to conventional insurance firms. Secondly, the Tobit results imply that the size, investment and claim are found negatively related with the efficiency of insurance companies which suggests that larger size raise the cost of doing business whereas, due to financial crises the investment of large firms are also dropped. Moreover, improvement in minimum capital requirement is found fruit full both for cost and profit efficiencies. Therefore, it is suggested that the regulators should keep continue this policy to further improve financial health of the insurance industry.
Key Words
Insurance, Takaful, Value added approach, SFA, Tobit
Introduction
Efficient utilization of resources is becoming essential for any kind of business since the firms have to survive in a extremely competitive environment where there are many substitutes available to customers. Therefore, the firms need to provide high quality products or services at least price to not only fulfill the needs of their customers but also to compete successfully. >Insurance firms are separated into two distinct types; General insurance (Property and Casualty) firms and life insurance firms. Life insurers protect families in event of premature death of their breadwinner whereas; general insurers protect the businesses entities from various risks. Therefore, both kinds of insurers not only protect individuals and businesses financially but also support them socially. >Other than the risk transfer’s function, insurance firms also participate as an institutional investor in the development of country since they invest their premiums and savings in the capital market. Therefore, insurance firms are essential for economical, technological and social development of any country. Their role is of more precise nature in the developing economies like Pakistan since the financial and technological uncertainties are somewhat higher in developing economies as compared to a developed economy. Therefore, it is essential for the emerging economies like Pakistan to have a efficient and sound structured insurance sector for the continuous growth of the country. >Six life insurance companies and thirty general insurance companies are operating in Islamic Republic of Pakistan (Insurance Association of Pakistan - IAP, 2011). Insurance sector flourished in recent years since total assets of life insurers are improved from Rs. 108 billion in 2003 to Rs. 229 billion and total assets of general insurers are increased from Rs. 37 billion in 2003 to Rs. 124 billion in 2009 (Securities and Exchange Commission of Pakistan (SBP), 2003; 2010). Moreover, the gross premiums of the life insurance industry were Rs. 42 billion in 2009 which were just Rs. 13 billion in 2003 whereas, the general insurance industry collected around Rs. 43 billion of gross premiums in 2009 which were just Rs. 19.3 billion in 2003 (SBP, 2003; SBP, 2010).>Takaful firms are also playing their part in the development of the country. Takaful firms attract those customers who have rejected or reluctant towards the conventional products of insurance industry based on the argument that they are against the teachings of Islam. In Pakistan, the initial Takaful firm was established in 2006 and since then they have shown significant progress as the number of active Takaful firms are now five, out of which three are general and two are family Takafuls (International Cooperative & Mutual Insurance Federation - ICMIF Takaful, 2010). Moreover, the gross contribution has risen from 265 million rupees to 1463 million rupees over the study period (SBP, 2010).>The regulators have taken various measures to financially strengthen the insurance industry of Pakistan such as the raise in minimum capital requirements of both insurers. Life insurers and general insurers have to maintain a minimum capital of 100 million and 50 million rupees in 2003 which is now raised to 500 million rupees and 300 million rupees in 2010, respectively (See Table 1)>. >Table 1. Increase in Minimum Capital Requirement> border="0" cellspacing="0" cellpadding="0">
Year
width="160">Life Insurers
width="160">General Insurers
2005
width="160">150 million
width="160">80 million
2006
width="160">150 million
width="160">80 million
2007
width="160">350 million
width="160">120 million
2008
width="160">400 million
width="160">160 million
2009
width="160">450 million
width="160">200 million
2010
width="160">500 million
width="160">250 million
2011
width="160">500 million
width="160">300 million
Literature Review
Many studies in the developed economies have analyzed efficiency of insurers (Eling and Luhnen, 2009). Some studies have evaluated the efficiency of insurance firms in developing economies. For instance; Huang (2007) analyzed efficiency of both life and general insurance firms in China with SFA technique from 1999 to 2004. It found an improvement in cost efficiency of Chinese insurance firms (from 36% to 40%). In another study by Sun and Chen (2011) analyzed cost efficiency of 23 Chinese insurance firms with SFA technique from 2005 to 2008. It was found that efficiency scores fall from 68% to 61%.
Hsiao et al (2011) also applied SFA to analyze cost efficiency of Taiwan’s life insurers over the period of 1997 to 2007. Mean cost efficiency of 67% was found in the life insurers. Moreover, the results also revealed that profitability, asset turnover, fixed asset and liquidity were positively associated in contrast; claims was found negatively associated with cost efficiency.
In the Islamic world, the insurance operations are considered as against the teachings of Islam. Therefore, a new product was developed which is called the Takaful. There are papers which have examined efficiency of these firms. For instance; Saad, et al (2006) compared the efficiency of Malaysian twelve conventional insurers and one Takaful firm with the help of DEA. This study found that Takaful firm have lower Total Factor of Productivity (TFP). In addition, the Takaful firm was found below average in all kind of efficiency scores except the scale efficiency. Yusop et al (2011) also compared efficiency of 15 insurers and 2 Takaful firms of Malaysia from 2003 to 07 with the help of DEA. It found that insurers have relatively higher efficiency scores but with a falling trend. Moreover, the results also implies that the Takaful firms outperformed the insurance firms.
Determinants of the efficiency is also extensively explored in empirical literature. Eling and Luhnen (2009) examined the efficiency of insurance firms from 36 economies over the period of 2002 to 2006 with both SFA and DEA techniques. DEA findings suggested that cost efficiency in general insurance firms was found 38% and in life insurance firms was 59%. SFA results revealed that cost efficiency in the general insurance firms was found 59 % and in life insurance firms was 74%. Moreover, the study also investigated the determinants of efficiency with the help of Tobit analysis and found that mutual funds were more efficient in comparison to stock funds. Furthermore, size was found positively associated with the inefficiency scores whereas, solvency ratio was found negatively related.
Although, there are some papers which investigated efficiency of insurers in Pakistan such as; Afza and Asghar (2010), Afza and Jam-e-Kausar (2010) and Afza and Asghar (2012). There is little evidence which compared efficiency of conventional insurers with Takaful firms such as; Khan and Noreen (2014) and Janjua and Akmal (2015). However, all of these studies only applied non-parametric (DEA) approach to compute their efficiency scores.
Present study followed the parametric SFA approach instead of the non-parametric approaches since the SFA has various advantages over the non-parametric approaches such as; the SFA assumes that residual of regression has two portions; 1) statistical noise and 2) inefficiency whereas, parametric approach do not consider it. Moreover, the parametric SFA has more restrictive functional form as compared to non-parametric DEA approach. Moreover, this study has also measured for the first time, the profit efficiency of insurance firms
Methodology
SFA was formulated by Aigner et al (1977), Battese and Corra (1977) and Meeusen and Broeck (1977). Coelli (1995) also preferred this method as compared to other methods. Current study has computed cost efficiency and profit efficiency since cost minimization and profit maximization are one of the important efficiencies which are extensively calculated by empirical studies. Translog function is used to calculate efficiency scores since it is the most extensively used in empirical literature (Wise, 2017). Present study has followed the same model which was applied by Asghar and Afza (2013).
Input and Output Variables
There is consensus amongst the researchers that the value added approach should be preferred. This study has included all the life insurance and general insurance firms along with the both family and general Takaful firms. Gross premiums and investments are selected as output variables whereas business services, labor, equity and debt capital are inputs. The input prices for labor is the total labor expenses to number of employees, for business services is the business services expenses to fixed assets. The price of equity is one of the challenging task to measure efficiency, especially in case of the financial sector. There are various choices included in the empirical literature to compute the price of equity such as; firstly, Return on Assets (ROA) which is often called as the best measure to compute the price of equity but this method has limitation since ROA can become negative which is not applicable in any of the frontier methods. Debt to Equity ratio since any increase in debt will raise the risk, therefore, the shareholders will ask for more required rate of return. This method ignores the market factors and only focuses on the raise in debt capital. CAPM is also used to compute the price of the equity (Cummins et al, 2011; Cummins et al 2010) but it is not applicable in case of the FIs in Pakistan since various large firms are not listed on any of the stock markets. In addition, even amongst the listed firms many of them have lower turnover as they are not frequently traded at stock exchanges in the country. Therefore, this study has used the 5 year average stock market rate of return by following Cummins and Rubio-Misas (2006), Diboky and Ubl (2007) and Eling and Lehnen (2009). It allows us to include the non-listed firms into the analysis. Moreover, it also solves the problem of illiquid stocks which are not frequently traded on the stock exchanges.
The price of debt capital is also difficult to measure since there are various measures to compute. For instance; Fenn et al (2008) and Biener and Eling (2009) have used the long term government bond rate, Diboky and Ubl (2007) also selected the German government bond. This study has selected the 12 month T. bill rate since it gives the recent minimum interest rate prevailing in the country in a particular year of analysis. The same measurement was also selected by Eling and Luhnen (2009). The total cost for the insurance sector is computed as management expenses + operating expenses incurred by the insurance firm.
Present study further analyzed the determinants of efficiency in insurance firms e.g. size, investments, profitability, solvency, risk, and liquidity with profit and cost efficiency. In addition, study has also investigated the relationship of reforms and the recent financial crises of 2008 on their efficiency with the help of a binary variables. The measurement of each variable is provided in the table 2. Model for insurance firms can be concluded as;
?i,t = ?1 + ?2SIZEi,t + ?3INVi,t + ?4PROFi,t + ?5EQTYi,t + ?6RISKi,t + ?7LQDTYi,t + ?8Dtypei,t + ?9Dbusi,t + ?10Dregi,t + ?11Duni,t + ? i,t
Table 2. Variables of Tobit Model
| (Measurements) | > ?: Efficiency Scores | > SIZE: Log of Total Assets | > INV: Net Investments / Total Assets | > PROF: ROA & ROE | > EQTY: Total Equity / Total Assets | > RISK: Net Claims / Net Premiums | > LQDTY: Current Assets / Current Liabilities | > Dtype: Dummy variable for type of operations, 1 if Takaful and 0 otherwise | > Dbus: Dummy variable, 1for life insurers and 0 for General insurers. | > Dreg: Dummy variable for financial reforms 1 if the firm increased its share capital to meet the minimum capital requirements and 0 otherwise. | > Dun: Dun: Dummy variable for financial uncertainties, 1 for the year 2008 and 0 otherwise |
Data
In the present analysis, 34 insurance firms (including Takaful firms) are evaluated over the period of 2005 to 2010. Descriptives are presented in Table 3. The gross premiums of the insurance firms are improved from 1530 million to 2745 million rupees. It implies that insurance sector is growing briskly. The investments made by these insurance firms are also increased from 5232 million to 9884 million rupees Amongst the inputs; labor and business services are also raised. Labor and its input price is raised from Rs. 123 million and Rs. 0.307 million to Rs. 224 million and Rs. 0.558 million, respectively. This increase in labor cost is due to hiring of competitive employees and also due to the increase of salaries of employees as a result of inflation. Business services and its input price is also boosted from 115 million and 1.69 million rupees to 220 million and 1.92 million rupees, respectively. This raise indicates that operational cost is increasing for the insurance firms in Pakistan.
Table 3. Outputs, Inputs, Input Prices (Descriptive Statistics)
| > > width="75" nowrap="" colspan="2">Output variables width="268" nowrap="" colspan="8">Input Variables & Input Prices width="71" nowrap="" colspan="2" valign="bottom">
| > Year width="23" nowrap="">Obs width="35" nowrap="">> width="38">Gross Investments width="35" nowrap="">Labor width="29">Price of Business Price of Equity width="31">Price of Debt width="31">Price of Total Total | > 2005 width="23" nowrap="" rowspan="2">29 width="35" nowrap="">Mean width="38" nowrap="">1529.76 width="37" nowrap="">5231.84 width="35" nowrap="">123.31 width="29" nowrap="">0.307 width="37" nowrap="">114.92 width="39" nowrap="">1.693 width="34" nowrap="">820.99 width="31" nowrap="">34.670 width="33" nowrap="">5835.09 width="31" nowrap="">8.076 width="33" nowrap="">241.29 width="38" nowrap="">264.44 | > SD width="38" nowrap="">2969.10 width="37" nowrap="">21666.1 width="35" nowrap="">260.22 width="29" nowrap="">0.159 width="37" nowrap="">211.88 width="39" nowrap="">3.031 width="34" nowrap="">1982.82 width="31" nowrap="">0.000 width="33" nowrap="">24155.0 width="31" nowrap="">0.000 width="33" nowrap="">469.18 width="38" nowrap="">504.19 | > 2006 width="23" nowrap="" rowspan="2">31 width="35" nowrap="">Mean width="38" nowrap="">1740.38 width="37" nowrap="">5958.47 width="35" nowrap="">164.98 width="29" nowrap="">0.359 width="37" nowrap="">124.58 width="39" nowrap="">1.730 width="34" nowrap="">1247.37 width="31" nowrap="">35.295 width="33" nowrap="">6299.02 width="31" nowrap="">8.882 width="33" nowrap="">294.36 width="38" nowrap="">558.76 | > SD width="38" nowrap="">3398.28 width="37" nowrap="">23767.2 width="35" nowrap="">419.91 width="29" nowrap="">0.181 width="37" nowrap="">205.11 width="39" nowrap="">2.914 width="34" nowrap="">2544.33 width="31" nowrap="">0.000 width="33" nowrap="">26459.6 width="31" nowrap="">0.000 width="33" nowrap="">619.38 width="38" nowrap="">1371.34 | > 2007 width="23" nowrap="" rowspan="2">31 width="35" nowrap="">Mean width="38" nowrap="">2012.26 width="37" nowrap="">7791.57 width="35" nowrap="">148.53 width="29" nowrap="">0.374 width="37" nowrap="">137.22 width="39" nowrap="">1.686 width="34" nowrap="">2369.33 width="31" nowrap="">43.093 width="33" nowrap="">7572.57 width="31" nowrap="">9.215 width="33" nowrap="">291.88 width="38" nowrap="">1157.33 | > SD width="38" nowrap="">3942.45 width="37" nowrap="">26955.4 width="35" nowrap="">286.09 width="29" nowrap="">0.166 width="37" nowrap="">225.31 width="39" nowrap="">2.876 width="34" nowrap="">4215.24 width="31" nowrap="">0.000 width="33" nowrap="">29898.6 width="31" nowrap="">0.000 width="33" nowrap="">504.27 width="38" nowrap="">2821.01 | > 2008 width="23" nowrap="" rowspan="2">34 width="35" nowrap="">Mean width="38" nowrap="">2151.40 width="37" nowrap="">7435.87 width="35" nowrap="">166.61 width="29" nowrap="">0.441 width="37" nowrap="">169.33 width="39" nowrap="">1.583 width="34" nowrap="">2049.92 width="31" nowrap="">43.831 width="33" nowrap="">7532.37 width="31" nowrap="">10.840 width="33" nowrap="">345.74 width="38" nowrap="">227.24 | > SD width="38" nowrap="">4525.26 width="37" nowrap="">28908.5 width="35" nowrap="">326.71 width="29" nowrap="">0.184 width="37" nowrap="">291.71 width="39" nowrap="">2.007 width="34" nowrap="">3577.90 width="31" nowrap="">0.000 width="33" nowrap="">32737.2 width="31" nowrap="">0.000 width="33" nowrap="">614.41 width="38" nowrap="">990.71 | > 2009 width="23" nowrap="" rowspan="2">34 width="35" nowrap="">Mean width="38" nowrap="">2422.88 width="37" nowrap="">8355.18 width="35" nowrap="">200.24 width="29" nowrap="">0.489 width="37" nowrap="">216.30 width="39" nowrap="">2.095 width="34" nowrap="">2197.57 width="31" nowrap="">28.794 width="33" nowrap="">8573.33 width="31" nowrap="">12.632 width="33" nowrap="">424.45 width="38" nowrap="">231.84 | > SD width="38" nowrap="">5363.24 width="37" nowrap="">32341.2 width="35" nowrap="">417.75 width="29" nowrap="">0.223 width="37" nowrap="">467.71 width="39" nowrap="">3.702 width="34" nowrap="">3909.41 width="31" nowrap="">0.000 width="33" nowrap="">36675.3 width="31" nowrap="">0.000 width="33" nowrap="">881.72 width="38" nowrap="">800.77 | > 2010 width="23" nowrap="" rowspan="2">33 width="35" nowrap="">Mean width="38" nowrap="">2745.33 width="37" nowrap="">9383.90 width="35" nowrap="">223.94 width="29" nowrap="">0.558 width="37" nowrap="">220.36 width="39" nowrap="">1.916 width="34" nowrap="">1852.48 width="31" nowrap="">11.147 width="33" nowrap="">10162.2 width="31" nowrap="">12.643 width="33" nowrap="">450.02 width="38" nowrap="">148.83 | > SD width="38" nowrap="">6637.65 width="37" nowrap="">37517.0 width="35" nowrap="">484.77 width="29" nowrap="">0.266 width="37" nowrap="">481.70 width="39" nowrap="">2.819 width="34" nowrap="">3160.29 width="31" nowrap="">0.000 width="33" nowrap="">43359.3 width="31" nowrap="">0.000 width="33" nowrap="">963.33 width="38" nowrap="">267.19 | > Average width="23" nowrap="" rowspan="2">192 width="35" nowrap="">Mean width="38" nowrap="">2118.84 width="37" nowrap="">7419.47 width="35" nowrap="">172.70 width="29" nowrap="">0.425 width="37" nowrap="">165.79 width="39" nowrap="">1.788 width="34" nowrap="">1778.51 width="31" nowrap="">32.670 width="33" nowrap="">7719.71 width="31" nowrap="">10.471 width="33" nowrap="">344.83 width="38" nowrap="">423.89 | > SD width="38" nowrap="">4647.48 width="37" nowrap="">28887.7 width="35" nowrap="">373.52 width="29" nowrap="">0.216 width="37" nowrap="">338.09 width="39" nowrap="">2.899 width="34" nowrap="">3346.13 width="31" nowrap="">11.146 width="33" nowrap="">32718.3 width="31" nowrap="">1.791 width="33" nowrap="">702.16 width="38" nowrap="">1412.65 | > Total Insurers width="376" nowrap="" colspan="11">34 | > Gross Premium width="305" nowrap="" colspan="9" valign="bottom">Total Gross Premiums width="33" nowrap="" valign="bottom">width="38" nowrap="" valign="bottom">
| > Investments width="305" nowrap="" colspan="9" valign="bottom">Investments width="33" nowrap="" valign="bottom"> width="38" nowrap="" valign="bottom"> | > Labor width="305" nowrap="" colspan="9" valign="bottom">Total salaries including all other incentives width="33" nowrap="" valign="bottom"> width="38" nowrap="" valign="bottom"> | > Price of Labor width="305" colspan="9" valign="bottom">Total salaries including all other incentives/Number of Employees width="33" nowrap="" valign="bottom"> width="38" nowrap="" valign="bottom"> | > Business Services width="305" nowrap="" colspan="9" valign="bottom">Total operating expenses excluding labor width="33" nowrap="" valign="bottom"> width="38" nowrap="" valign="bottom"> | > Price of Bus. Services width="305" colspan="9" valign="bottom">Total operating expenses excluding labor/Operating Fixed Assets width="33" nowrap="" valign="bottom"> width="38" nowrap="" valign="bottom"> | > Equity width="305" nowrap="" colspan="9" valign="bottom">Total Equity width="33" nowrap="" valign="bottom"> width="38" nowrap="" valign="bottom"> | > Price of Equity width="305" nowrap="" colspan="9" valign="bottom">5-Year-Average KSE rate of return (%) width="33" nowrap="" valign="bottom"> width="38" nowrap="" valign="bottom"> | > Debt width="305" nowrap="" colspan="9" valign="bottom">Total Debt width="33" nowrap="" valign="bottom"> width="38" nowrap="" valign="bottom"> | > Price of Debt width="305" nowrap="" colspan="9" valign="bottom">12 month T. bill rate (%) width="33" nowrap="" valign="bottom"> width="38" nowrap="" valign="bottom"> | > Total Cost width="305" nowrap="" colspan="9" valign="bottom">Management + Financial + Operating Expenses width="33" nowrap="" valign="bottom"> width="38" nowrap="" valign="bottom"> | > Total Profit width="305" nowrap="" colspan="9" valign="bottom">Total profit before tax width="33" nowrap="" valign="bottom"> width="38" nowrap="" valign="bottom"> | |||||||||||||||||||||||||||||||||||||||||
Equity is also increased from Rs. 821 million to Rs. 1852 million. This sharp raise is due to the increase of minimum capital requirement imposed by SECP to financially strengthen the insurance firms in Pakistan. Debt capital is also increased; this is because of the significant growth in insurance industry. Price of equity is raised till 2008 and then sharply falls due to the significant fall at Karachi Stock Exchange (KSE) in the later part of the study. Debt price is also increase which can be attributed to increase of interest rates in T. bills by State Bank of Pakistan (SBP). As like input costs, the total cost of the insurance firms is also sharply raised. The profitability of the insurers is increased till 2007 and then fall because of the KSE crash in 2008 since insurance firms mostly invest their funds at capital market. Standard deviation of the insurance firms for almost all of the variables is very high.
The descriptives of the explanatory variables selected for Tobit regression are provided in table 4. The results suggest that the total assets of the insurance firms are increased from 6656 million rupees to 10771 million rupees over the study period. It indicates that the size of insurance firms is significantly improved. Investments of the insurance firms almost remain same which indicates that although the investments are increased in amount but not in proportion to the total assets.
Insurance firms have earned positive returns except in year 2008 and 2009 which suggest that the financial uncertainty has adversely affected insurers. Equity is improved over the years due to increase in compulsory minimum capital requirement to strengthen the insurance sector. Liquidity level is also raised which suggest that the insurance firms are now more tend to invest in money market to satisfy the claims.
Table 4. Descriptive Statistics of Insurance Firms (Tobit Model) over the period of 2005 to 2010
| Variables nowrap="" colspan="2">2005 nowrap="" colspan="2">2006 nowrap="" colspan="2">2007 nowrap="" colspan="2">2008 nowrap="" colspan="2">2009 nowrap="" colspan="4">2010 nowrap="" colspan="3">Average | > Mean nowrap="">SD nowrap="">Mean nowrap="">SD nowrap="">Mean nowrap="">SD nowrap="">Mean nowrap="">SD nowrap="">Mean nowrap="">SD width="28" nowrap="">Mean width="34" nowrap="" colspan="2">SD nowrap="" colspan="2">Mean width="38" nowrap="" colspan="2">SD | > SIZE (MILLAIONS) nowrap="" valign="bottom">6656 nowrap="" valign="bottom">24379 nowrap="" valign="bottom">7546 nowrap="" valign="bottom">26684 nowrap="" valign="bottom">9942 nowrap="" valign="bottom">30282 nowrap="" valign="bottom">9582 nowrap="" valign="bottom">33006 nowrap="" valign="bottom">10771 nowrap="" valign="bottom">37003 width="28" nowrap="" valign="bottom">12015 width="34" nowrap="" colspan="2" valign="bottom">43601 nowrap="" colspan="2" valign="bottom">9498.22 width="38" nowrap="" colspan="2" valign="bottom">33008 | > SIZE nowrap="">6.984 nowrap="">1.547 nowrap="">7.177 nowrap="">1.582 nowrap="">7.592 nowrap="">1.630 nowrap="">7.497 nowrap="">1.548 nowrap="">7.544 nowrap="">1.599 width="28" nowrap="">7.574 width="34" nowrap="" colspan="2">1.596 nowrap="" colspan="2">7.405 width="38" nowrap="" colspan="2">1.579 | > INV nowrap="">48.034 nowrap="">25.940 nowrap="">50.406 nowrap="">24.718 nowrap="">47.945 nowrap="">27.298 nowrap="">50.711 nowrap="">26.164 nowrap="">51.705 nowrap="">25.000 width="28" nowrap="">50.745 width="34" nowrap="" colspan="2">25.677 nowrap="" colspan="2">49.993 width="38" nowrap="" colspan="2">25.502 | > ROA nowrap="">10.863 nowrap="">8.267 nowrap="">14.032 nowrap="">15.610 nowrap="">16.216 nowrap="">19.556 nowrap="">-0.151 nowrap="">10.099 nowrap="">-3.930 nowrap="">22.019 width="28" nowrap="">1.685 width="34" nowrap="" colspan="2">7.931 nowrap="" colspan="2">6.091 width="38" nowrap="" colspan="2">16.697 | > ROE nowrap="">29.527 nowrap="">17.611 nowrap="">30.530 nowrap="">20.505 nowrap="">32.701 nowrap="">33.877 nowrap="">-0.829 nowrap="">22.300 nowrap="">-5.054 nowrap="">48.952 width="28" nowrap="">6.699 width="34" nowrap="" colspan="2">19.422 nowrap="" colspan="2">14.779 width="38" nowrap="" colspan="2">33.241 | > EQTY nowrap="">38.144 nowrap="">17.302 nowrap="">44.098 nowrap="">23.289 nowrap="">44.813 nowrap="">25.733 nowrap="">49.602 nowrap="">25.443 nowrap="">48.527 nowrap="">24.075 width="28" nowrap="">45.849 width="34" nowrap="" colspan="2">23.888 nowrap="" colspan="2">45.374 width="38" nowrap="" colspan="2">23.535 | > RISK nowrap="">0.441 nowrap="">0.180 nowrap="">0.455 nowrap="">0.170 nowrap="">0.495 nowrap="">0.211 nowrap="">2.126 nowrap="">9.191 nowrap="">0.464 nowrap="">0.318 width="28" nowrap="">0.472 width="34" nowrap="" colspan="2">0.279 nowrap="" colspan="2">0.760 width="38" nowrap="" colspan="2">3.879 | > LQDTY nowrap="">1.164 nowrap="">0.632 nowrap="">1.564 nowrap="">1.244 nowrap="">1.858 nowrap="">2.672 nowrap="">1.854 nowrap="">1.678 nowrap="">1.747 nowrap="">2.176 width="28" nowrap="">1.971 width="34" nowrap="" colspan="2">3.867 nowrap="" colspan="2">1.705 width="38" nowrap="" colspan="2">2.302 | > Dtakaful nowrap="">0.138 nowrap="">0.351 nowrap="">0.161 nowrap="">0.374 nowrap="">0.161 nowrap="">0.374 nowrap="">0.206 nowrap="">0.410 nowrap="">0.206 nowrap="">0.410 width="28" nowrap="">0.212 width="34" nowrap="" colspan="2">0.415 nowrap="" colspan="2">0.182 width="38" nowrap="" colspan="2">0.387 | > Dbus nowrap="">0.000 nowrap="">0.000 nowrap="">0.000 nowrap="">0.000 nowrap="">0.000 nowrap="">0.000 nowrap="">0.088 nowrap="">0.288 nowrap="">0.088 nowrap="">0.288 width="28" nowrap="">0.091 width="34" nowrap="" colspan="2">0.292 nowrap="" colspan="2">0.047 width="38" nowrap="" colspan="2">0.212 | > Dreg nowrap="">0.034 nowrap="">0.186 nowrap="">0.161 nowrap="">0.374 nowrap="">0.355 nowrap="">0.486 nowrap="">0.235 nowrap="">0.431 nowrap="">0.353 nowrap="">0.485 width="28" nowrap="">0.242 width="34" nowrap="" colspan="2">0.435 nowrap="" colspan="2">0.234 width="38" nowrap="" colspan="2">0.425 | > Dcs nowrap="">0.000 nowrap="">0.000 nowrap="">0.000 nowrap="">0.000 nowrap="">0.000 nowrap="">0.000 nowrap="">1.000 nowrap="">0.000 nowrap="">0.000 nowrap="">0.000 width="28" nowrap="">0.000 width="34" nowrap="" colspan="2">0.000 nowrap="" colspan="2">0.177 width="38" nowrap="" colspan="2">0.383 | > Obs nowrap="" colspan="2">29 nowrap="" colspan="2">31 nowrap="" colspan="2">31 nowrap="" colspan="2">34 nowrap="" colspan="2">34 nowrap="" colspan="4">33 nowrap="" colspan="3">192 | > SIZE nowrap="" colspan="10" valign="bottom">Natural log of Total Assets width="43" nowrap="" colspan="2" valign="bottom"> width="49" nowrap="" colspan="2" valign="bottom"> nowrap="" colspan="2" valign="bottom"> nowrap="" valign="bottom"> | > INV nowrap="" colspan="7" valign="bottom">Total Investments / Total Assets (%) nowrap="" valign="bottom"> nowrap="" valign="bottom"> nowrap="" valign="bottom"> width="43" nowrap="" colspan="2" valign="bottom"> width="49" nowrap="" colspan="2" valign="bottom"> nowrap="" colspan="2" valign="bottom"> nowrap="" valign="bottom"> | > ROA nowrap="" colspan="8" valign="bottom">Profit before tax / Total Assets (%) nowrap="" valign="bottom">nowrap="" valign="bottom"> width="43" nowrap="" colspan="2" valign="bottom"> width="49" nowrap="" colspan="2" valign="bottom"> nowrap="" colspan="2" valign="bottom"> nowrap="" valign="bottom">
| > ROE nowrap="" colspan="8" valign="bottom">Profit before tax / Equity (%) nowrap="" valign="bottom">nowrap="" valign="bottom"> width="43" nowrap="" colspan="2" valign="bottom"> width="49" nowrap="" colspan="2" valign="bottom"> nowrap="" colspan="2" valign="bottom"> nowrap="" valign="bottom">
| > EQTY nowrap="" colspan="8" valign="bottom">Total Equity / Total Assets (%) nowrap="" valign="bottom">nowrap="" valign="bottom"> width="43" nowrap="" colspan="2" valign="bottom"> width="49" nowrap="" colspan="2" valign="bottom"> nowrap="" colspan="2" valign="bottom"> nowrap="" valign="bottom">
| > RISK nowrap="" colspan="10" valign="bottom">Net Claims / Net Premiums width="43" nowrap="" colspan="2" valign="bottom">width="49" nowrap="" colspan="2" valign="bottom"> nowrap="" colspan="2" valign="bottom"> nowrap="" valign="bottom">
| > LQDTY nowrap="" colspan="10" valign="bottom">Current Assets / Current Liabilities width="43" nowrap="" colspan="2" valign="bottom">width="49" nowrap="" colspan="2" valign="bottom"> nowrap="" colspan="2" valign="bottom"> nowrap="" valign="bottom">
| > Dtakaful nowrap="" colspan="14" valign="bottom">Dummy variable; 1 if the mean of business is Islamic (Takaful) and 0 otherwise nowrap="" colspan="2" valign="bottom">nowrap="" valign="bottom">
| > Dbus nowrap="" colspan="17" valign="bottom">Dummy variable; It will be 1 for life insurance firms and 0 for general insurance firms | > Dreg nowrap="" colspan="17" valign="bottom">Dummy variable; It will be 1 if paid-up capital is increased by the insurance firm and 0 otherwise | > Dcs width="432" nowrap="" colspan="17" valign="bottom">Dummy variable; 1 for the year 2008 and 0 otherwise |
Empirical Results
The results are provided in the table 5 which suggest that the insurance firms of Pakistan have 75% profit efficiency and 73.8% cost efficiency. The profit efficiency results imply that the insurance firms of Pakistan can earn same profit with the utilization of 25% less input to produce their outputs. The Co-operative insurance firm is the most profit efficiency insurance firm since the average profit efficiency score is found 97.6%. The reason behind their higher profit efficiency is that the Co-operative insurance firm remains profitable over the study period although many of the firms earn negative profits in 2009. The State Life Insurance Corporation is found as the least profit efficient as its efficiency score is found just 45.7%. Although the firm earn positive profits over the study period but still the profits are marginally very low as compared to other less resourced insurance firms. This is due to the fact that the State Life Insurance Corporation is earning less profit in proportion to their total assets. Moreover, this result can be the result of their high operating cost which also raise their cost of doing business as compared to their rivals. The National Insurance Corporation Limited (NICL) is the most cost efficient insurance firm. This result suggests that the firm is utilizing lower resources as compared to its rivals. In contrast, Dawood Takaful is found as the least efficient insurance firm since this firm has lower outputs, specifically their premiums.
The results also indicate that the general insurance firms have higher efficiency in comparison to life insurance firms. It implies that life insurance sector need to seriously revisit their operating activities and cost structure to improve their efficiency scores. Takaful firms are found significantly inefficient in their cost efficiency, the efficiency results reveal that the Takaful firms have just 37% efficiency which is almost the half of the overall efficiency of the insurance industry. It suggests that Takaful firms are still at initial stage and they need to take up serious steps to improve their market share which may help them to improve their efficiency.
Table 5. Efficiency of Insurance Firms (2005-2010)
| Insurance Firm width="126" nowrap="">Type width="102" nowrap="">SFAPE width="82" nowrap="">SFACE | > Adamjee Insurance width="126" nowrap="">General width="102" nowrap="">0.634 width="82" nowrap="">0.751 | > Alpha Insurance width="126" nowrap="">General width="102" nowrap="">0.821 width="82" nowrap="">0.758 | > Asia Insurance width="126" nowrap="">General width="102" nowrap="">0.836 width="82" nowrap="">0.754 | > Askari Insurance width="126" nowrap="">General width="102" nowrap="">0.695 width="82" nowrap="">0.679 | > Atlas Insurance width="126" nowrap="">General width="102" nowrap="">0.817 width="82" nowrap="">0.841 | > Capital Insurance width="126" nowrap="">General width="102" nowrap="">0.957 width="82" nowrap="">0.874 | > Central Insurance width="126" nowrap="">General width="102" nowrap="">0.612 width="82" nowrap="">0.724 | > Century Insurance width="126" nowrap="">General width="102" nowrap="">0.752 width="82" nowrap="">0.812 | > Cooperative Insurance width="126" nowrap="">General width="102" nowrap="">0.976 width="82" nowrap="">0.808 | > Crescent Star Insurance width="126" nowrap="">General width="102" nowrap="">0.900 width="82" nowrap="">0.755 | > EFU General Insurance width="126" nowrap="">General width="102" nowrap="">0.638 width="82" nowrap="">0.827 | > East West Insurance width="126" nowrap="">General width="102" nowrap="">0.758 width="82" nowrap="">0.605 | > Habib Insurance width="126" nowrap="">General width="102" nowrap="">0.767 width="82" nowrap="">0.712 | > IGI Insurance width="126" nowrap="">General width="102" nowrap="">0.508 width="82" nowrap="">0.659 | > Jubilee Insurance width="126" nowrap="">General width="102" nowrap="">0.866 width="82" nowrap="">0.850 | > National Insurance width="126" nowrap="">General width="102" nowrap="">0.685 width="82" nowrap="">0.916 | > Pak. General Insurance width="126" nowrap="">General width="102" nowrap="">0.878 width="82" nowrap="">0.707 | > Premier Insurance width="126" nowrap="">General width="102" nowrap="">0.540 width="82" nowrap="">0.624 | > PICIC Insurance width="126" nowrap="">General width="102" nowrap="">0.871 width="82" nowrap="">0.854 | > Reliance Insurance width="126" nowrap="">General width="102" nowrap="">0.829 width="82" nowrap="">0.762 | > Saudi Pak Insurance width="126" nowrap="">General width="102" nowrap="">0.752 width="82" nowrap="">0.767 | > Security Insurance width="126" nowrap="">General width="102" nowrap="">0.595 width="82" nowrap="">0.711 | > Shaheen Insurance width="126" nowrap="">General width="102" nowrap="">0.850 width="82" nowrap="">0.893 | > Silver Star Insurance width="126" nowrap="">General width="102" nowrap="">0.907 width="82" nowrap="">0.889 | > United Insurance width="126" nowrap="">General width="102" nowrap="">0.871 width="82" nowrap="">0.798 | > Universal Insurance width="126" nowrap="">General width="102" nowrap="">0.855 width="82" nowrap="">0.769 | > American Life Insurance width="126" nowrap="">Life width="102" nowrap="">0.772 width="82" nowrap="">0.764 | > EFU Life Insurance width="126" nowrap="">Life width="102" nowrap="">0.489 width="82" nowrap="">0.852 | > East West Life Insurance width="126" nowrap="">Life width="102" nowrap="">0.780 width="82" nowrap="">0.781 | > Jubilee Life Insurance width="126" nowrap="">Life width="102" nowrap="">0.549 width="82" nowrap="">0.793 | > State Life Insurance width="126" nowrap="">Life width="102" nowrap="">0.457 width="82" nowrap="">0.693 | > Pak Qatar Family Takaful width="126" nowrap="">Family Takaful width="102" nowrap="">0.782 width="82" nowrap="">0.448 | > Dawood Family Takaful width="126" nowrap="">Family Takaful width="102" nowrap="">0.648 width="82" nowrap="">0.191 | > Pak Qatar Takaful width="126" nowrap="">General Takaful width="102" nowrap="">0.844 width="82" nowrap="">0.483 | > Mean width="126" nowrap="">width="102" nowrap=""> 0.750 width="82" nowrap="">0.738 | > Mean (General) width="126" nowrap="">width="102" nowrap=""> 0.776 width="82" nowrap="">0.773 | > Mean (Life) width="126" nowrap="">width="102" nowrap=""> 0.609 width="82" nowrap="">0.713 | > Mean (Islamic Takaful) width="126" nowrap="">width="102" nowrap=""> 0.758 width="82" nowrap="">0.374 | > Maximum width="126" nowrap="">width="102" nowrap=""> 0.976 width="82" nowrap="">0.916 | > Minimum width="126" nowrap="">width="102" nowrap=""> 0.457 width="82" nowrap="">0.191 |
SFAPE: Profit Efficiency calculated with SFA Model
SFACE: Cost Efficiency calculated with SFA Model
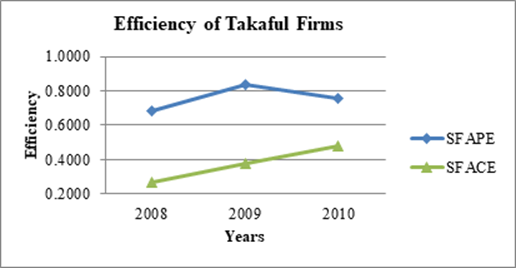
The efficiency trend of cost and profit efficiency scores is presented in figure 1 (a, b, c) which reveals that profit efficiency of both type of insurers is fall after 2006 but they made a recovery especially after 2009. The fall in efficiency may be because of the lower growth in this period since the insurance premiums grew just at the rate of 3% in 2008 and 2009 as compared to 17% from 2003 to 2007 (Afza and Asghar, 2012). The cost efficiency results implies that the both type of insurers have slightly raised their cost efficiency which reveals that the management successfully reducing their cost. Although, the overall efficiency scores of the Takaful firms are lower (profit efficiency) but these firms have raised their efficiency level which suggest that Takaful firms have improved their operations both in terms of their cost and profitability.
Figure (1a)

Figure (1b)

Figure (1c)

SFAPE: Profit Efficiency calculated with SFA Model
SFACE: Cost Efficiency calculated with SFA Model
Tobit Results
The results imply that size is negatively and significantly associated with profit efficiency (See table 6). This result reveals that the large insurers instead of taking benefit of their size, failed to do so. Investment is also found negatively and significantly related with both cost and profit efficiencies which reveals that large insurers with large amount of investments failed to invest their money at optimum level. It suggests that larger size raise the cost of doing business whereas, due to financial crises of 2008 the investment of large firms are also sharply dropped. Therefore, these are found negatively related with the efficiency of insurance firms. Profitability is positively and significantly associated with profit efficiency. This result was as expected since Diacon et al (2002) and Ochala (2017) have also found same.
Claim is found negatively associated with both efficiencies which implies that higher risk reduces efficiency of the insurance firms. Therefore, insurance firms need to control their claims to optimally perform since any unprecedented raise in claims can increase the cost of doing business. Dummy variable is used to find the relationship of business operations (Life or General) with the efficiency scores and the results suggest that the dummy variable is negatively associated with the cost efficiency that suggests that life insurers have lower cost efficiency in comparison to general insurers as discussed earlier in the table (5). Barros (2005) also found negative association between efficiency and the life insurers. Dummy variable for the regulatory change is positively and significantly associated with cost efficiency which indicates that the increase in minimum capital requirement is proven fruitful as it enhances the cost efficiency. Dummy variable for financial uncertainties is not found significant with all of the efficiency scores which implies that financial uncertainties is significantly affected efficiency of insurers.
Table 6. Tobit Results of Insurance Companies Stochastic Frontier Approach
| Variables width="158" nowrap="" colspan="2">PE width="184" nowrap="" colspan="2">CE | > ? width="66" nowrap="">Sig width="98" nowrap="">? width="86" nowrap="">Sig | > SIZE width="92" nowrap="">-0.052*** width="66" nowrap="">0.000 width="98" nowrap="">0.0108 width="86" nowrap="">0.000 | > INV width="92" nowrap="">-0.003*** width="66" nowrap="">0.000 width="98" nowrap="">-0.0011* width="86" nowrap="">0.007 | > ROA width="92" nowrap="">0.0068*** width="66" nowrap="">0.000 width="98" nowrap="">-0.0001 width="86" nowrap="">0.000 | > EQTY width="92" nowrap="">0.0005 width="66" nowrap="">0.546 width="98" nowrap="">-0.0002*** width="86" nowrap="">0.001 | > CLM width="92" nowrap="">-0.0043 width="66" nowrap="">0.254 width="98" nowrap="">-0.0051* width="86" nowrap="">0.056 | > LQDTY width="92" nowrap="">-0.0049 width="66" nowrap="">0.466 width="98" nowrap="">-0.0028 width="86" nowrap="">0.818 | > Dtakaful width="92" nowrap="">0.1033* width="66" nowrap="">0.085 width="98" nowrap="">0.0139 width="86" nowrap="">0.663 | > Dbus width="92" nowrap="">0.0986 width="66" nowrap="">0.231 width="98" nowrap="">-0.329*** width="86" nowrap="">0.365 | > Dreg width="92" nowrap="">0.0358** width="66" nowrap="">0.298 width="98" nowrap="">0.0498* width="86" nowrap="">0.002 | > Dcs width="92" nowrap="">-0.0462 width="66" nowrap="">0.199 width="98" nowrap="">-0.0047 width="86" nowrap="">0.008 | > Cons width="92" nowrap="">1.2186*** width="66" nowrap="">0.000 width="98" nowrap="">0.7493*** width="86" nowrap="">0.000 | > LR Chi width="158" nowrap="" colspan="2">105.98 width="184" nowrap="" colspan="2">72.13 | > Prob>Chi width="158" nowrap="" colspan="2">0 width="184" nowrap="" colspan="2">0 | > Likelihood width="158" nowrap="" colspan="2">53.31663 width="184" nowrap="" colspan="2">109.21289 | > Pseudo R Sq width="158" nowrap="" colspan="2">-163.2462 width="184" nowrap="" colspan="2">-0.493 | > Obs width="158" nowrap="" colspan="2">192 width="184" nowrap="" colspan="2">192 |
Conclusion
The insurance firms have higher efficiency level since efficiency scores for the insurance firms in Pakistan are found more than 74%. It suggests that the insurance firms are operating somewhat efficiently as they are attaining higher profit efficiency and also consuming less cost to achieve higher cost efficiency. Moreover, the findings also indicate that life insurers are performing poorly in comparison to general insurance firms. The inefficiency of life insurers is due to the fact that there are just five life insurers which are operating in the country which result in lack of competition. It is suggested that the government should encourage life insurance firm into the sector to enhance the competition which ultimately improve their efficiency.
The Takaful firms are performing poorly in comparison to conventional insurance except the cost efficiency. It implies that Takaful firms are operating efficiently in the country although the time span of the Takaful firms is very short. The cost efficiency is lower due to the fact of that Takaful firms are recently incorporated, therefore, their fixed cost may be higher which actually raise their cost of doing business. Takaful firms may improve their cost efficiency as they will continuously grow and will establish their selves in future.
The efficiency trend analysis of insurance firms implies that although the efficiency scores in various kinds of insurance firms have fall till 2008 but after that the efficiency scores are improved. This result suggests that the insurers were influenced by the financial uncertainties but the insurance firms have recovered quite well. This may be due to the fact that the regulators have raised the minimum capital requirement of the insurance firms to financially strengthen the firm which enable the insurers to sustain this financial crisis period.
size is negatively related with the cost efficiency which implies that the larger raise the cost of doing business. The management of insurers have to rationalize cost of doing business through lower usage of office supplies and also through getting maximum output from the employees. Investments are found negatively related with the both efficiencies which implies that the firms which have higher investments are lower efficient. This result may be due to the fact that the large insurers with higher investments are not investing as optimally as like their small counter parts. This result may be due to the financial uncertainties which cause the fall of stock market crash of Karachi Stock Exchange (KSE) in 2008 which drop the price of investments. The insurance firms mostly invest their funds in the stock market which is not a good alternative for a longer period of time since the KSE is one of the highly speculative stock markets of the world. It is suggested that the management of the insurance firms have also to consider other investment alternatives other than the stock market to avoid such a dramatic loss in future. They can invest in property and commodity markets to make a lower risky portfolio with the usage of derivatives.
Risk is found negatively related with both efficiencies which implies that insurance firms have to reduce their claims ratio to improve their both efficiencies. For this purpose, they can make higher standards for especially general insurance firms so that the chances of loss should decrease. They should have to learn from the experiences of the developed economies and have to raise the standards to get the insurance policy. For this purpose, the IAP and the regulatory bodies need to step forward for generalization of the rules. The raise in the minimum capital requirement is found fruit full as it is found positively related with both efficiencies of the insurance firms. As it has raised the financial strength of the insurance firms therefore, it is suggested that the insurance firms should carry on this policy to further improve the financial health of the insurance industry.
There are some overall general suggestions for the insurance industry. It is suggested that the insurance firms should create new products as the insurance density ratio is very low in Pakistan. For this purpose, the insurance firms need to develop insurance products for the agriculture sector of Pakistan as the most of the country man power is directly or indirectly associated with it. Moreover, the mobile industry is growing dramatically in Pakistan, therefore, it is also an opportunity for the insurance firms to develop new insurance products. Furthermore, the government has to infer for making of regulations to make the insurance products on public transport to financially facilitate the transporters and the passengers in case of any accident or other misshape.
Fig (a)
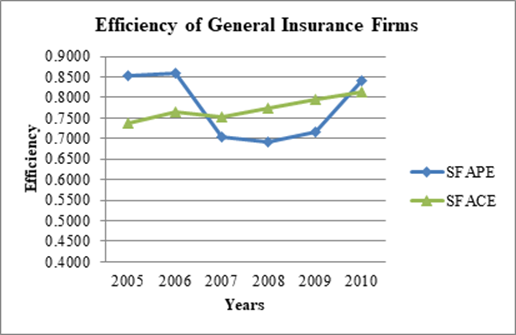
Fig (b)
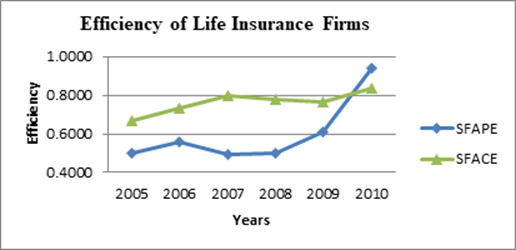
Fig (c)
References
- Afza, T. and Asghar, M. J. K. A. (2010) Efficiency of the Insurance Industry in Pakistan: An Application of Non-parametric Approach, Interdisciplinary Journal of Contemporary Research in Business, 2 (8), 84-98
- Afza, T. and Asghar, M. J. K. A. (2012) Financial Reforms and Efficiency in the Insurance Firms of Pakistan, African Journal of Business Management, 6(30), 8957-8963
- Afza, T. and Jam-e-Kausar (2010) Firm Size and Efficiency in the General Insurers of Pakistan, Journal of Quality and Technology Management, 6 (2), 165-183.
- Aigner, D., Lovell, C. K. and Schmidt, P. (1977) Formulation and Estimation of Stochastic Frontier Production Function Models, Journal of Econometrics, 6, 21-37
- Asghar, M. J. K. A. and Afza, T. (2013) Efficiency of Modaraba and Leasing Firms in Pakistan, Middle East Journal of Scientific Research, 17(3), 305-314.
- Battese G. E. and CORRA G. S. (1977) Estimation of a production frontier model: With application to the pastoral zone of eastern Australia, Australian Journal of Agricultural Economics, 21(3), 169-79.
- Biener C. and Eling M. (2009) The Performance of Micro insurance Programs: A Frontier Efficiency Analysis, Working Paper, Institute of Insurance Sciences, Ulm University, Ulm, Germany.
- Coelli, T. J. (1995) Recent developments in frontier modelling and efficiency measurement, Australian Journal of Agricultural Economics banner, 39(3), 219-245.
- Cummins J. D. and Rubio-Misas, M. (2006) Deregulation, Consolidation, and Efficiency: Evidence from the Spanish Insurance Industry, Journal of Money,Credit and Banking 38(2), 323-355.
- Cummins J. D. and Rubio-Misas, M. (2016) Integration and efficiency convergence in European Life insurance markets, SSRN:
- Cummins, J. D., Feng, F. and Weiss, M. A. (2011) The impact of reinsurance on ceding insurersÂ’ efficiency in the Property-Liability insurance industry: Affiliation and Domicile Effects, Working paper, Temple University, Philadelphia
- Cummins, J. D., M. A. Weiss, X Xie, and H. Zi (2010) Economies of scope in financial services: A DEA efficiency analysis of the US insurance industry, Journal of Banking and Finance. 34, 1525-1539
- Cummins, J.D. and Zi, H. (1998) Comparison of Frontier Efficiency Methods: An Application to the U.S. Life Insurance Industry, Journal of Productivity Analysis, 10 (2), 131-152.
- Diacon, S. R., Starkey, K., & O'Brien, C. (2002) Size and efficiency in European long-term insurance firms: An international comparison, The Geneva Papers on Risk and Insurance, Issues and Practice, 27(3), 444-466.
- Diboky F. and E. Ubl (2007) Ownership and efficiency in the German life insurance market: A DEA bootstrap approach, University of Vienna, Vienna, Austria.
- Eling & Luhnen, (2009) Efficiency in the international insurance industry: A cross country comparison, Journal of Banking and Finance, 34(7), 1497-1509
- Fenn, P., Vencappa, D., Diacon, S., Klumpes, P. and O'Brien, C., (2008) Market structure and efficiency of Europeaninsurance firms: a stochastic frontier analysis, Journal of Banking and Finance, 32 (1), 86-100
- Hsiao, S. H., Tzung, M. P., Meng, L. S. and Shu Y. S. (2011) Cost Efficiency in the Life Insurance Industry, Journal of Convergence Information Technology, 6(3), 120-131.
- Huang, W., (2007) Efficiency in the China Insurance Industry: 1999-2004, Working Paper, American Risk and Insurance Association (ARIA), PA, USA
- Janjua, P. Z. and Akmal, M. (2015) A Comparative analysis of economic efficiency of conventional and Islamic insurance industry in Pakistan, Pakistan Business Review, 17(1), 21-44
- Kader, H. A., Mike A., Philip H. and W. Jean Kown (2010) An Analysis of Cost Efficiency and the Impact of Corporate Governance on Takaful Insurance Operations, Working paper, School of Business and Economics, UK
- Khan, A., Noreen, U. (2014) Efficiency Measure of Insurance vs Takaful Firms Using DEA Approach: A Case of Pakistan, Journal Islamic Economic Studies, 22(1), 139-158.
- Meeusen, W. and Broeck, J. V. (1977) Efficiency estimation from Cobb-douglas production functions with composed errors, International Economic Review, 18, 435-444
- Ochala, P. (2017) A two-stage performance improvement evaluation of the insurance industry in Kenya: An application of data envelopmentanalysis and tobit regression model, International Journal of Economics, Commerce and Management, 5(5), 152-170
- Saad, N. M., M. Shabri A. M., Rosylin M. Y., Jarita D. and Abdul R. A. R. (2006) Measuring Efficiency of Insurance and Takaful Firms in Malaysia using Data Envelopment Analysis, Review of Islamic Economics, 10 (2), 5-26
- Sun W. and Chen Z. (2011) Cost X efficiency in ChinaÂ’s insurance firms: A stochastic frontier approach, African Journal of Business Management, 5(30), 11916-11924
- Weiss, M. A., (1991) Efficiency in the Property-Liability insurance industry, Journal of Risk and Insurance, 58(3), 452-479
- Wise, W. (2017) A survery of life insurance efficiency papers: Methods, pros & cons, trends, Accounting, 3, 137-170.
- Yusop Z., Alias R., Noriszura I. and Rubayah Y. (2011) Risk Management Efficiency of Conventional Life Insurers and Takaful Operators, Insurance Markets and Firms: Analyses and Actuarial Computations, 2(1), 58-68.
Cite this article
-
APA : Asghar, M. J. e. K. A., Khan, A. Z., & Khan, H. G. A. (2018). Takaful, Insurer type and Efficiency: An Application of Parametric Approach. Global Regional Review, III(I), 234-252. https://doi.org/10.31703/grr.2018(III-I).17
-
CHICAGO : Asghar, Muhammad Jam e Kausar Ali, Abdul Zahid Khan, and Hafiz Ghufran Ali Khan. 2018. "Takaful, Insurer type and Efficiency: An Application of Parametric Approach." Global Regional Review, III (I): 234-252 doi: 10.31703/grr.2018(III-I).17
-
HARVARD : ASGHAR, M. J. E. K. A., KHAN, A. Z. & KHAN, H. G. A. 2018. Takaful, Insurer type and Efficiency: An Application of Parametric Approach. Global Regional Review, III, 234-252.
-
MHRA : Asghar, Muhammad Jam e Kausar Ali, Abdul Zahid Khan, and Hafiz Ghufran Ali Khan. 2018. "Takaful, Insurer type and Efficiency: An Application of Parametric Approach." Global Regional Review, III: 234-252
-
MLA : Asghar, Muhammad Jam e Kausar Ali, Abdul Zahid Khan, and Hafiz Ghufran Ali Khan. "Takaful, Insurer type and Efficiency: An Application of Parametric Approach." Global Regional Review, III.I (2018): 234-252 Print.
-
OXFORD : Asghar, Muhammad Jam e Kausar Ali, Khan, Abdul Zahid, and Khan, Hafiz Ghufran Ali (2018), "Takaful, Insurer type and Efficiency: An Application of Parametric Approach", Global Regional Review, III (I), 234-252
-
TURABIAN : Asghar, Muhammad Jam e Kausar Ali, Abdul Zahid Khan, and Hafiz Ghufran Ali Khan. "Takaful, Insurer type and Efficiency: An Application of Parametric Approach." Global Regional Review III, no. I (2018): 234-252. https://doi.org/10.31703/grr.2018(III-I).17